

Places. Search them, analyse them, join them to your data.
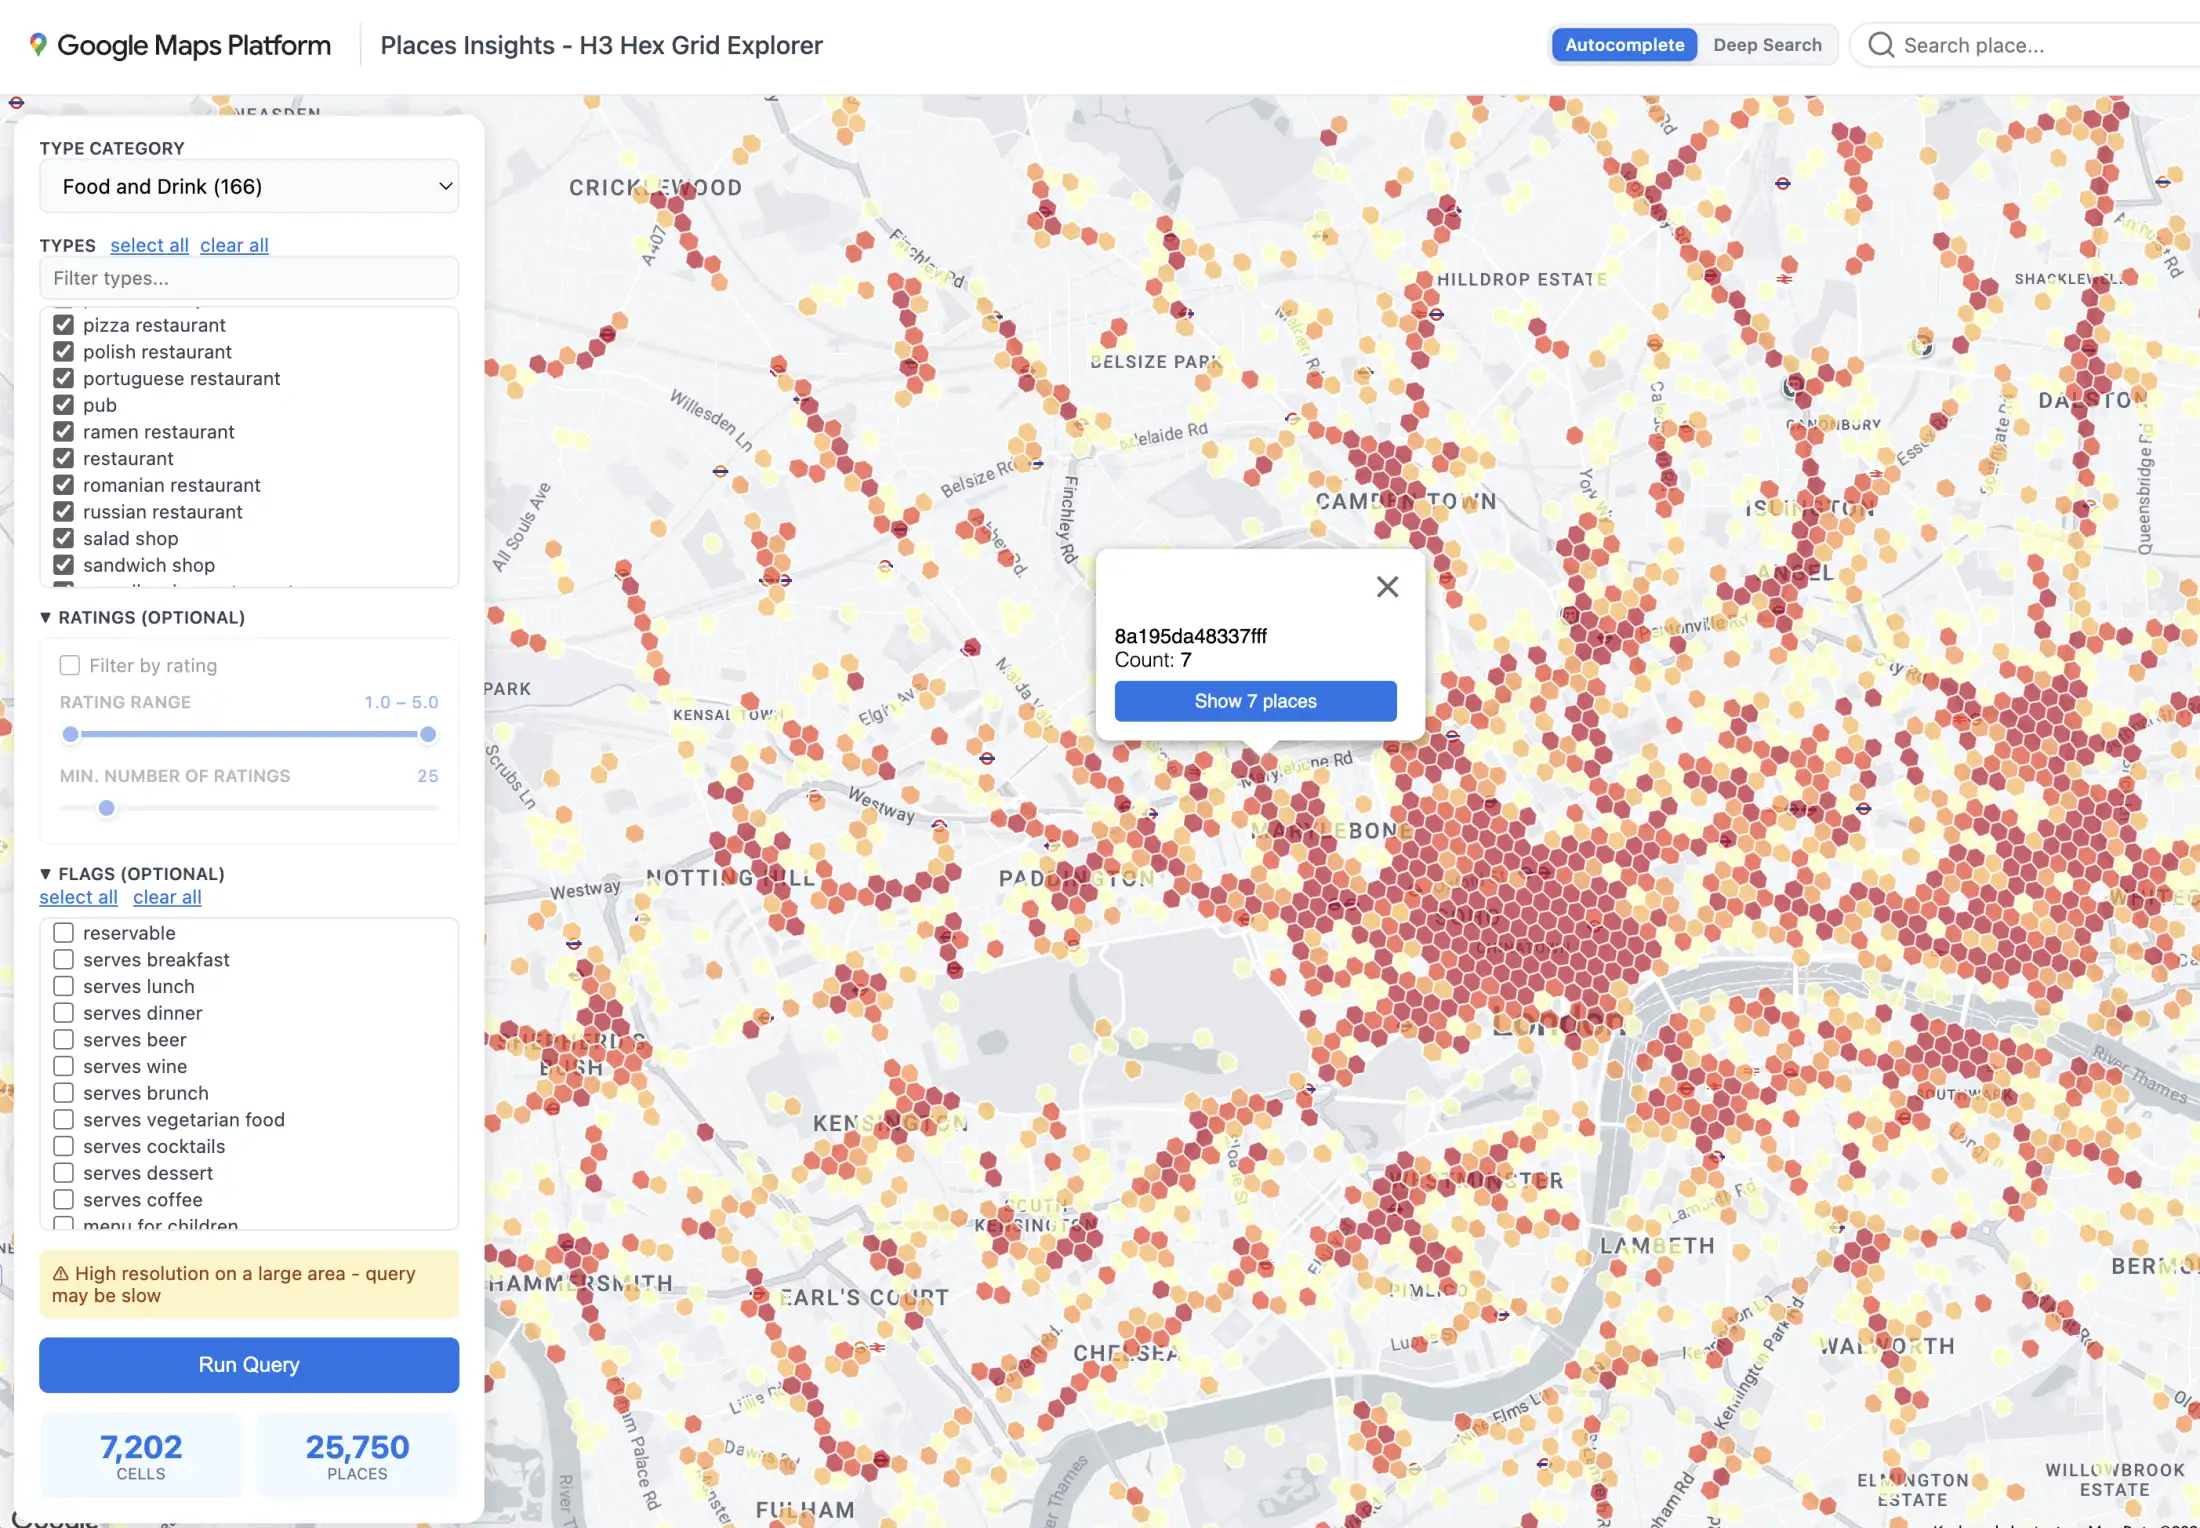
Knowing what’s around a site drives most location decisions. We use Google’s places data for both jobs: helping your customers find you, and helping you decide where to go next.
The platform. From finding one place to analysing millions.
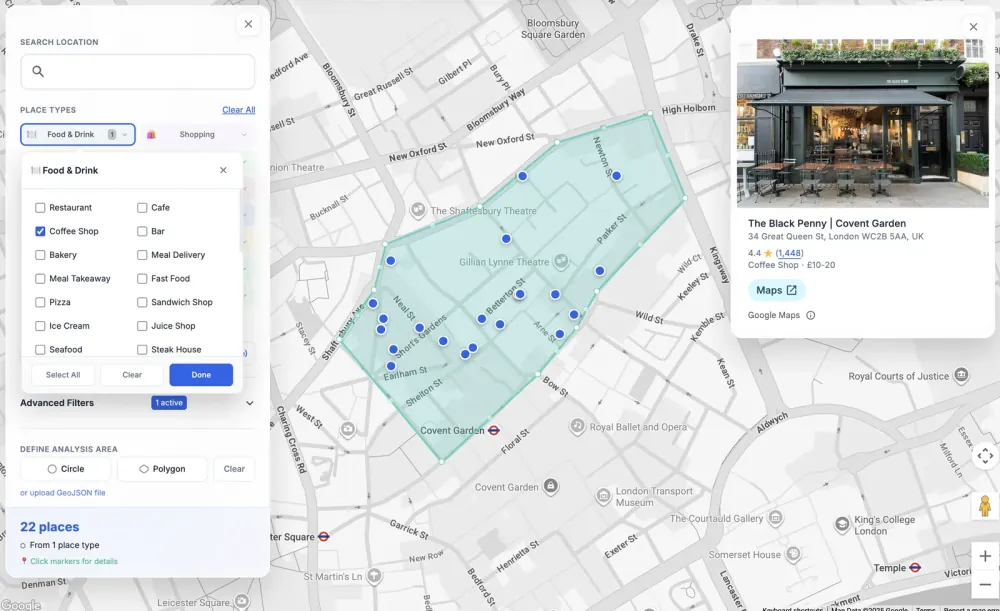
Place search
Autocomplete and text search that find any address or business as people type.
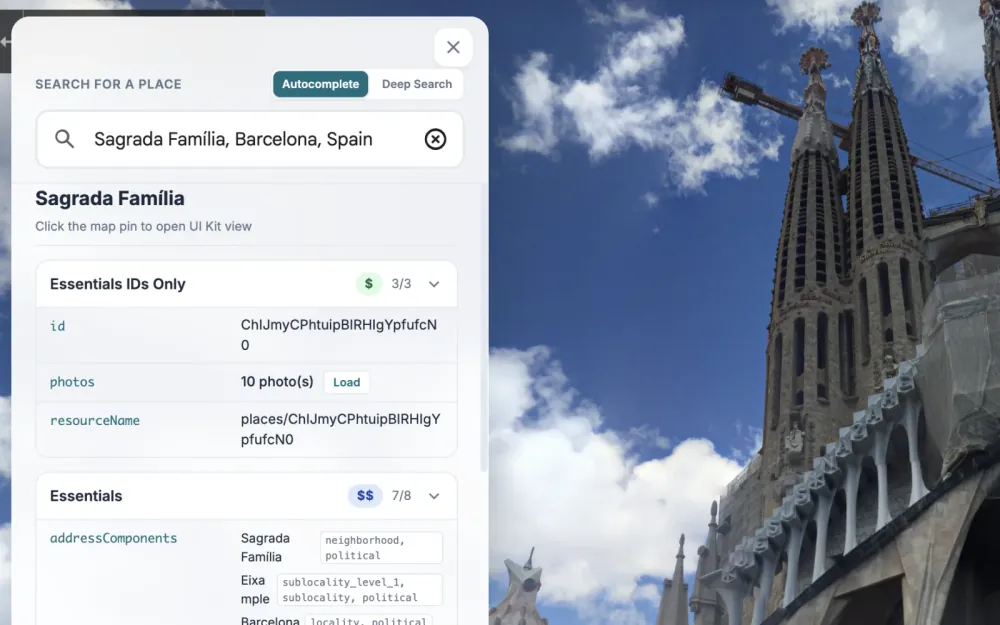
Place details
Opening hours, ratings, photos and more for any place.
Places Insights
Counts and attributes for hundreds of millions of places, updated monthly, as statistics in your own BigQuery project.
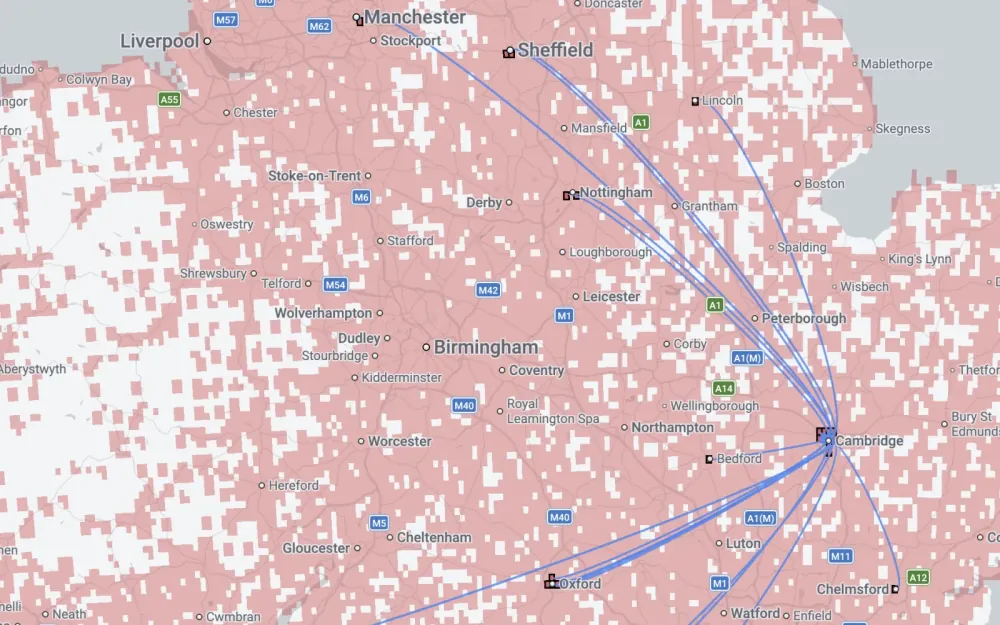
Population Dynamics
A numerical profile of every area, built from Google’s signals, to find areas like your best ones.
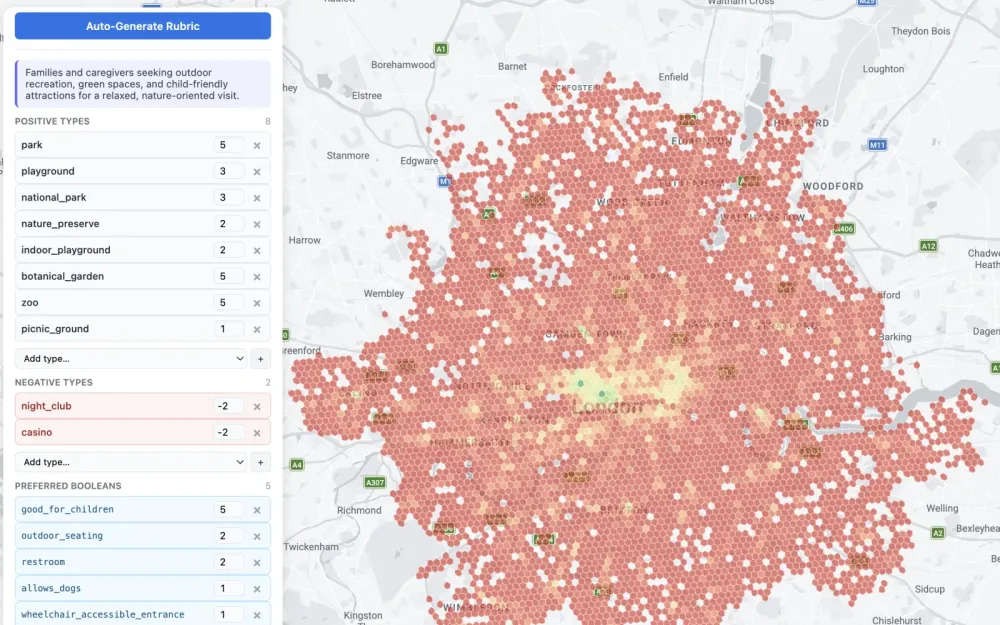
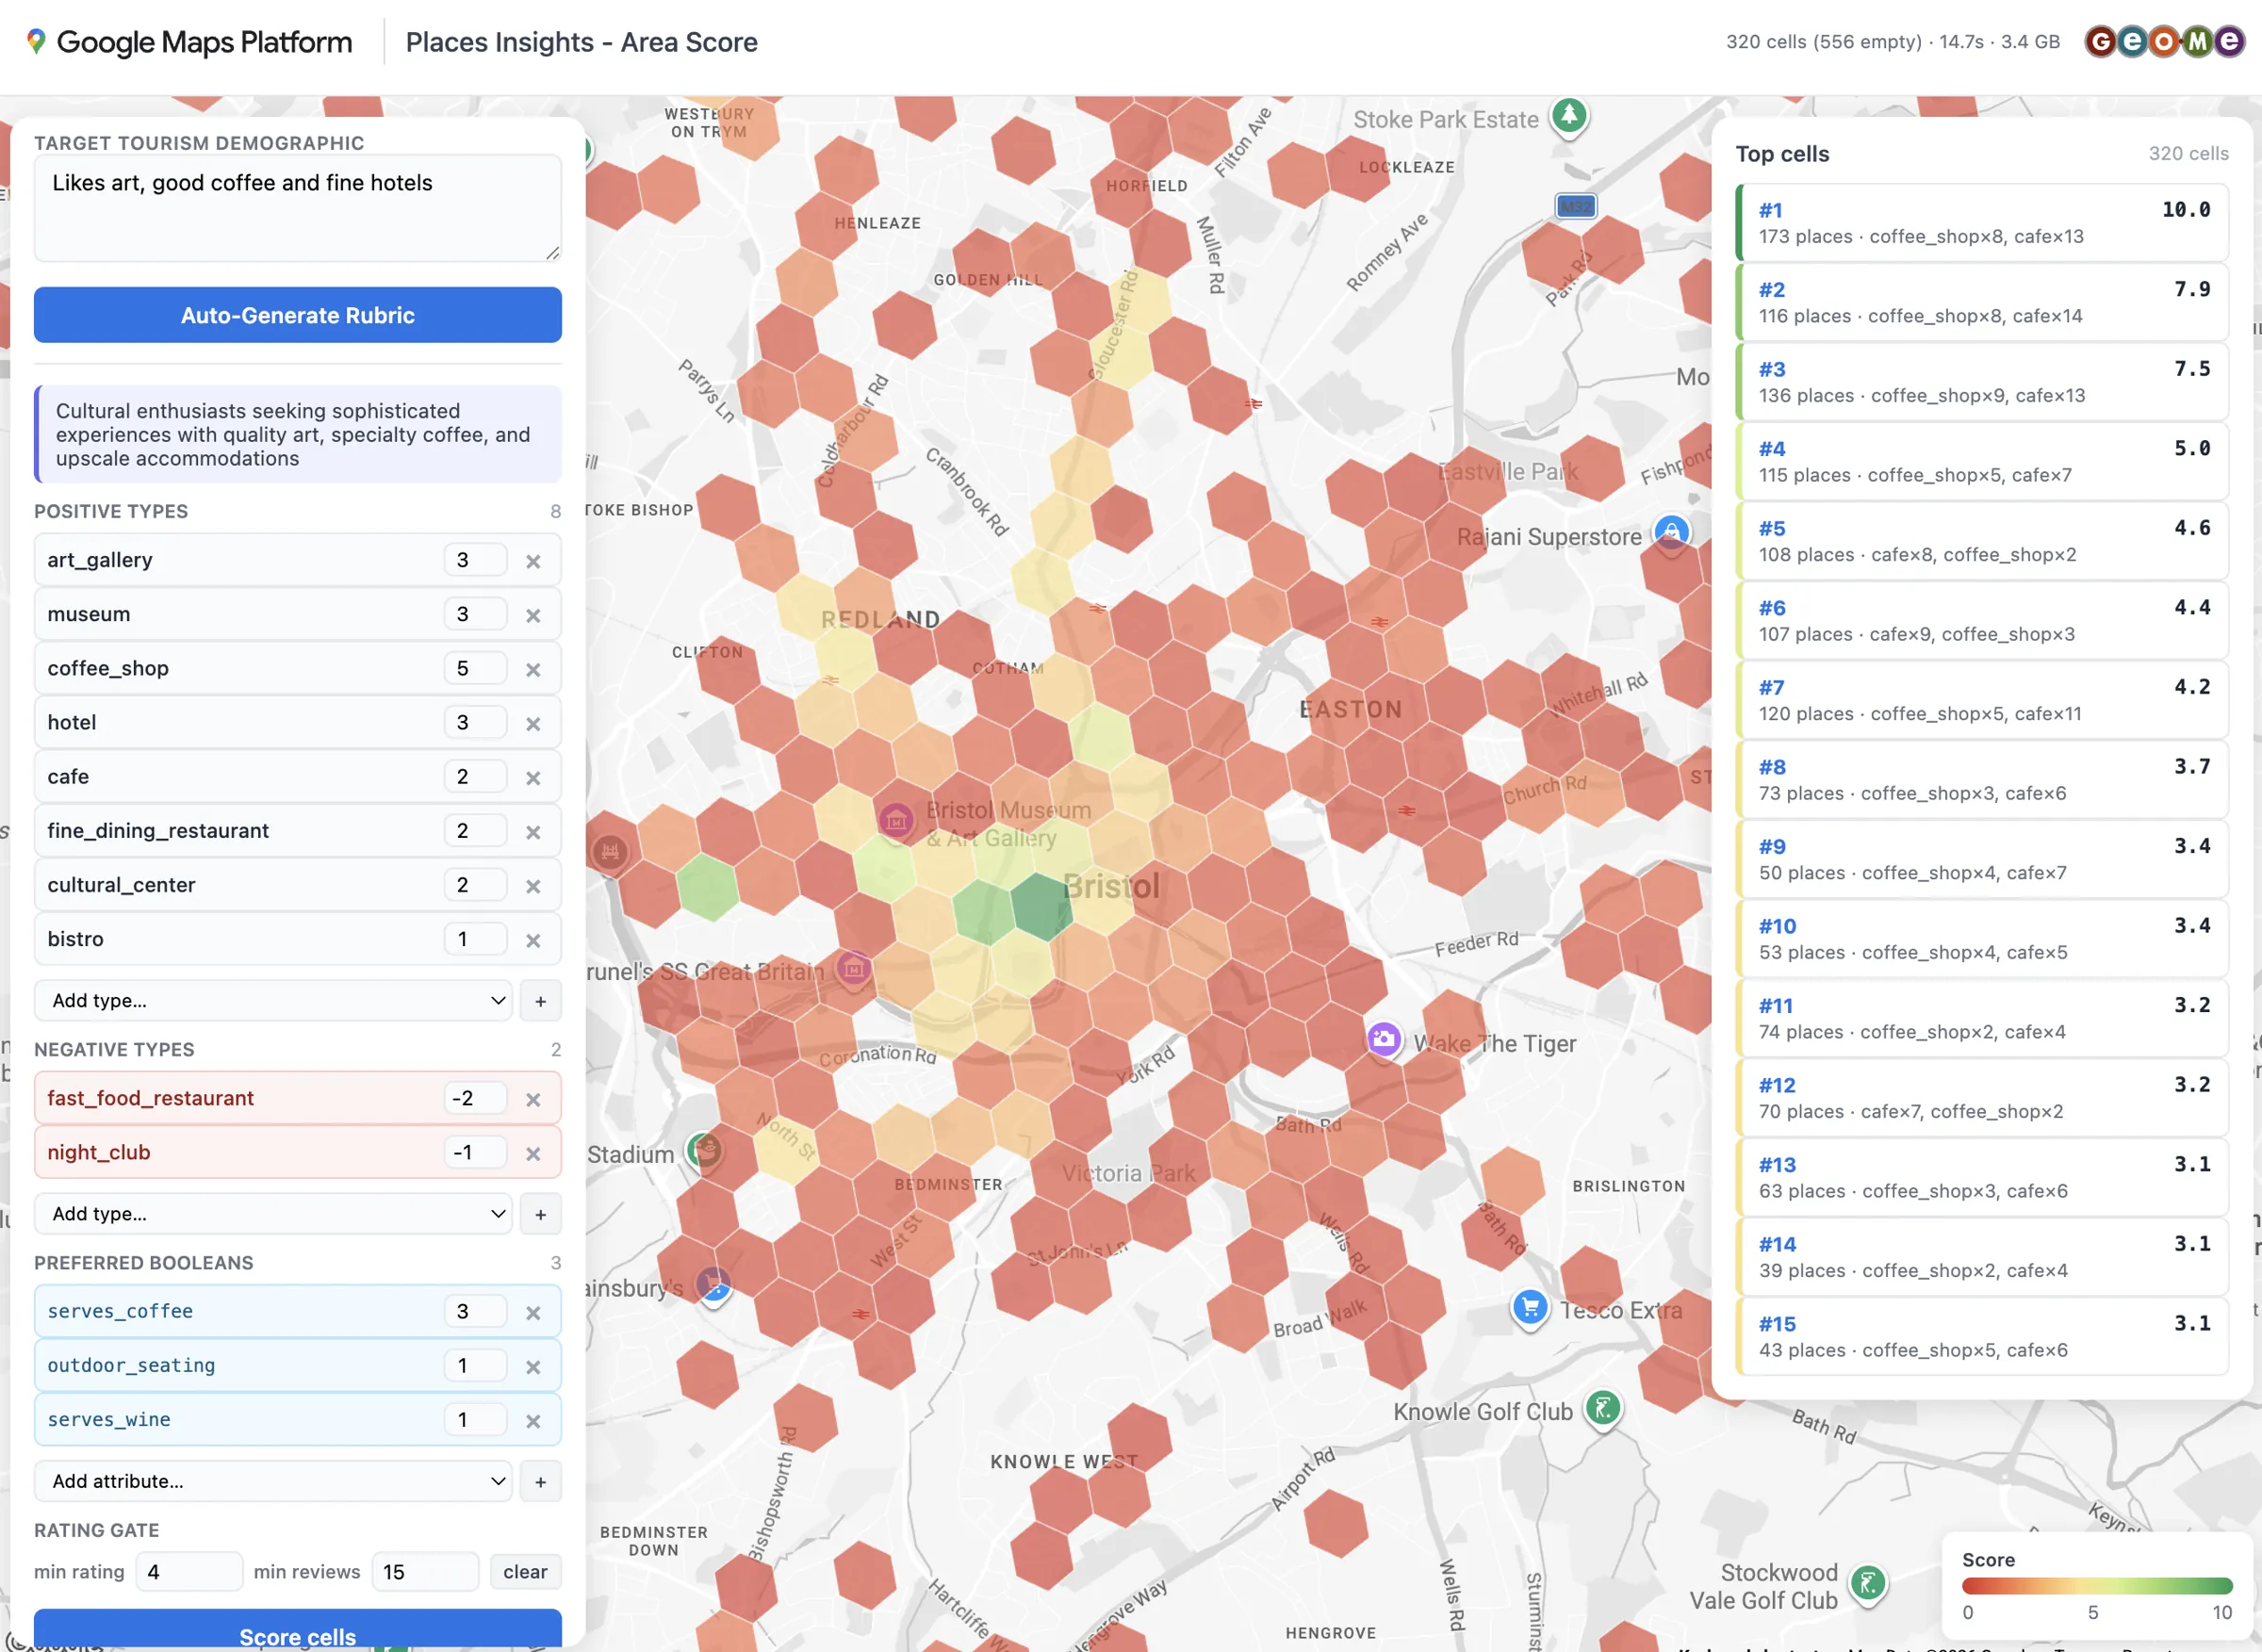
Area scores. Rank every area for the signals that matter to you.
Describe the mix of places that matters to you, from coffee shops and galleries to pharmacies and primary schools, and we score every hexagon in a city against it. Add reach areas and the score follows what people can get to on foot, by bike or by car.
The result shows where the mix is strongest, where it’s thin, and the places behind each score.
What we build. Answers on your sites, opportunities, risks and markets.
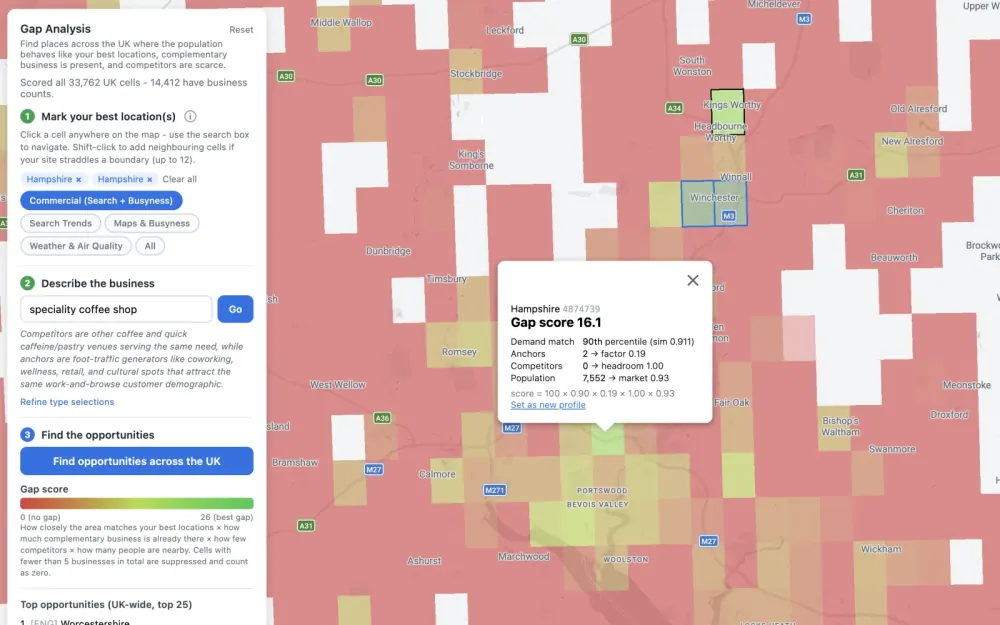
Site selection
Where to open next, from competitors, complementary businesses and the people within reach.
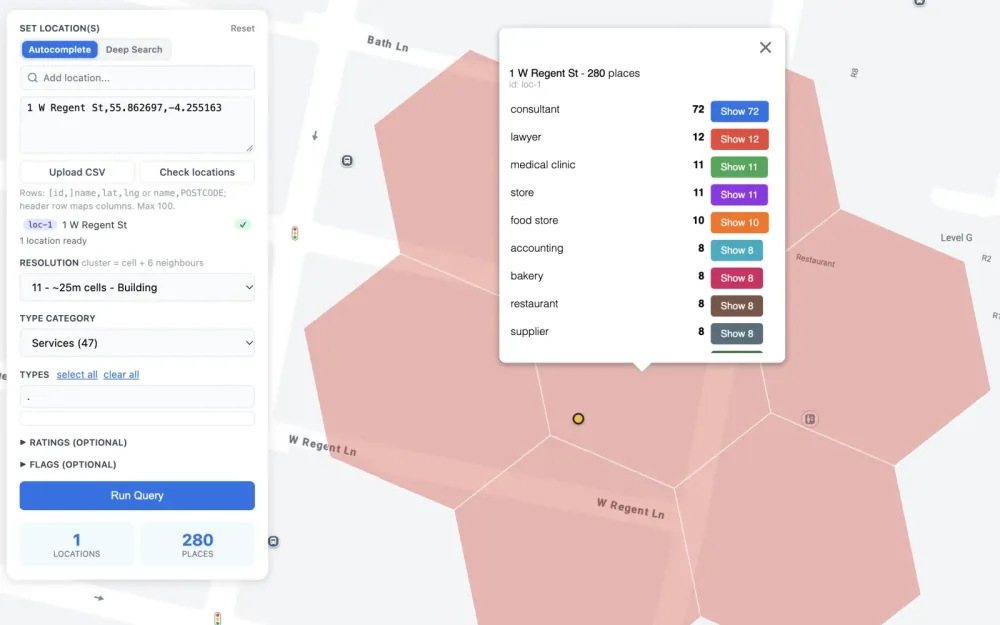
Risk profiles
What surrounds each insured property, across a commercial portfolio.
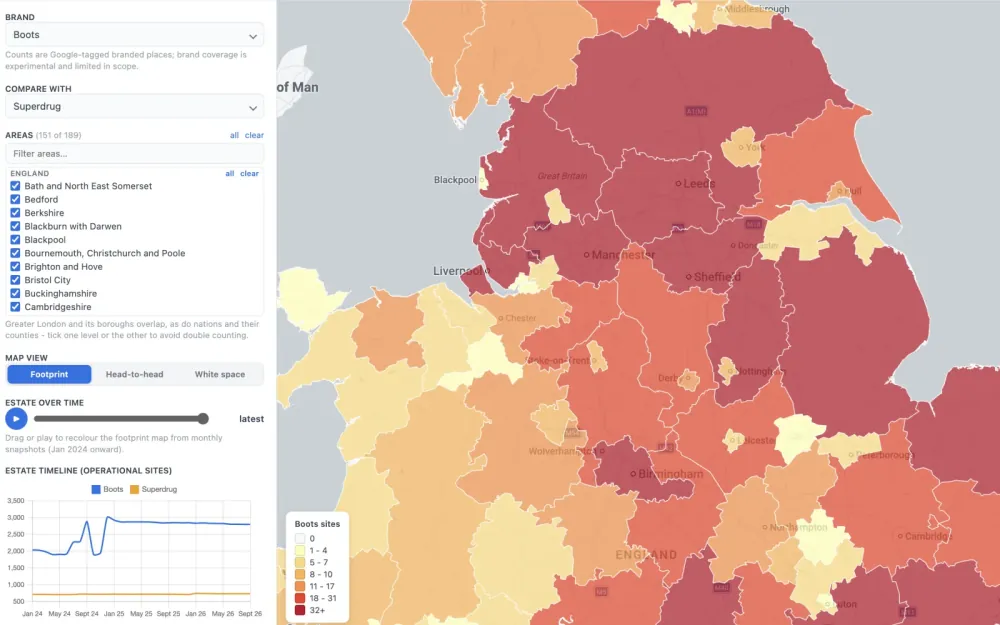
Market analysis
How brands and sectors spread across your markets, and how that’s changing month by month.
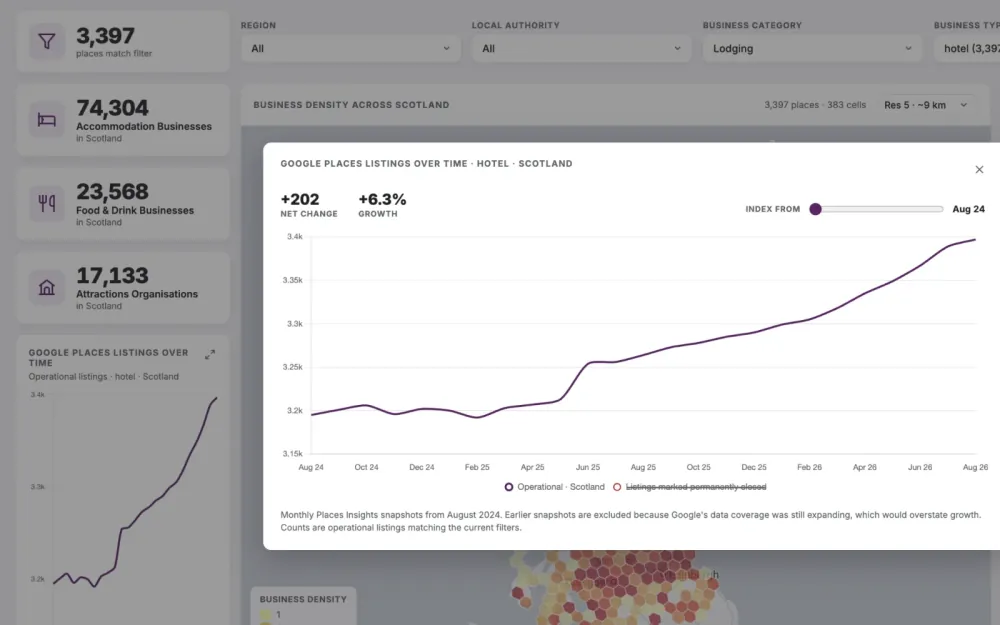
Applications people use
Map explorers and dashboards on your data, set up properly in your own Google Cloud project.